Create and deploy a dashboard with Panel and CDS Dashboards
Introduction
Analyzing data provides insights, and a dashboard stitches these insights into a meaningful story. Fortunately, there are many great open source dashboards tools out there that you can use to organize and display your data in an engaging and digestible way.
In this tutorial, you'll learn how to create a new dashboard with Panel within Nebari. You'll also learn how to share your newly created dashboard with other users with ContainDS Dashboards (CDS Dashboards).
note
Currently, CDS Dashboards supports Panel, Bokeh, Voila, Streamlit, and Plotly.
For this tutorial, you'll use Holoviews and Panel with Bokeh as backend.
Step 1- Creating the dashboard
Let's get our hands dirty
- Once in Nebari, create a new Jupyter notebook. Make sure to assign this a meaningful name, such as
panel-trees-dashboard.ipynb. - Select an environment from the
select kerneldropdown (this dropdown menu is located in the top right corner of your notebook). - Copy the code below into a
codecell of your notebook.
import pandas as pd
import holoviews as hv
from bokeh.models import HoverTool
import panel as pn
hv.extension('bokeh')
pn.extension()
# creating a sample dataset
data_trees = { 'species_name': ['live oak', 'pecan', 'bur oak', 'cedar elm'],
'avg_diameter_inch': [20, 30, 40, 35]
}
df = pd.DataFrame(data_trees)
# adding curve/line and bar plots
plot_bar = hv.Bars(df, 'species_name', 'avg_diameter_inch')
plot_curve = hv.Curve(df)
# creating hover tooltip
hover = HoverTool(tooltips=[("avg diameter", "@avg_diameter_inch"),
("species", "@species_name")])
# plot customization
combine_plot = plot_bar.opts(tools=[hover]) + plot_curve.opts(line_dash='dashed')
# creating a dashboard using panel
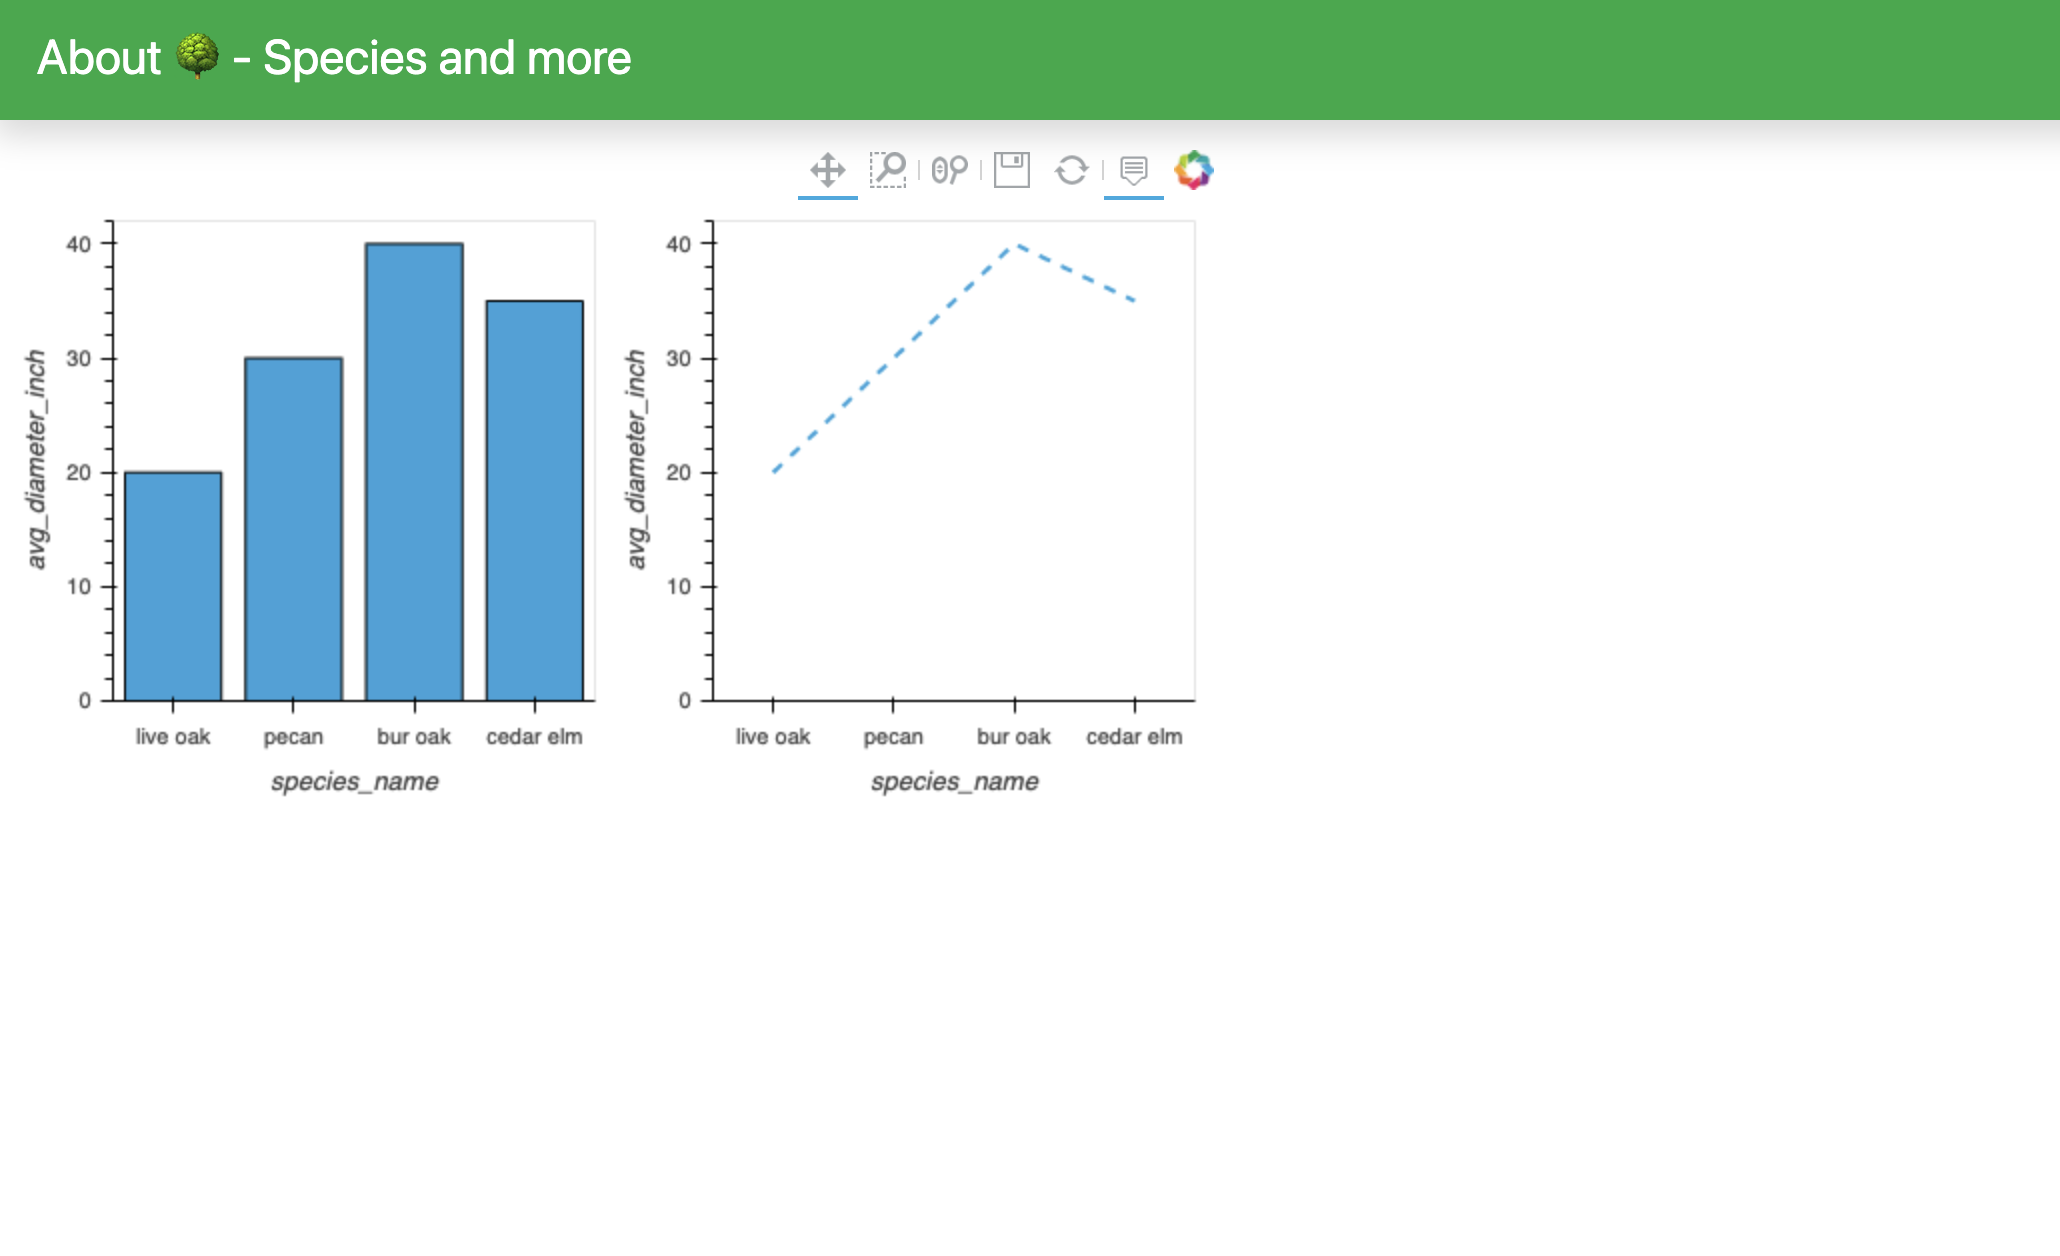
dashboard = pn.template.BootstrapTemplate(
site="About 🌳",
title="Species and more",
main=[combine_plot]
)
dashboard.servable()
- You can now run all the cells in your notebook and view the Panel dashboard as an output right inside the notebook.
This interactive feature of Panel makes it possible to rapidly prototype and iterate on dashboards.
At this point, you can add more plots or different styles to your plots, or you can move forward to the deployment section of this tutorial.
Step 2 - Deploying your panel dashboard with CDS dashboards
In this section, you'll use CDS Dashboards to publish and share your newly created panel dashboard.
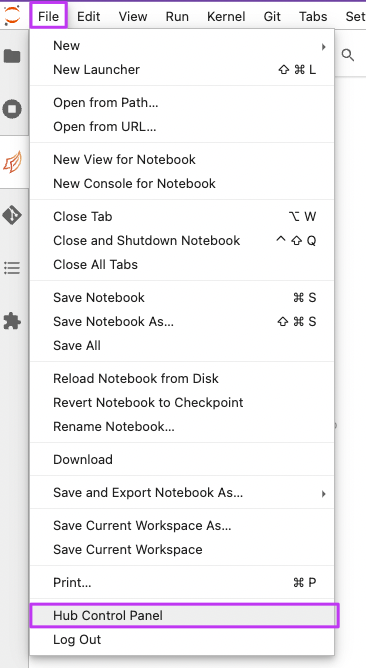
To begin, click on the top left tab navigate to File -> Hub Control Panel -> Dashboards. Click on the button New Dashboard. You will now be presented with a new window where you'll need to provide additional details for your dashboard (see image below for reference).
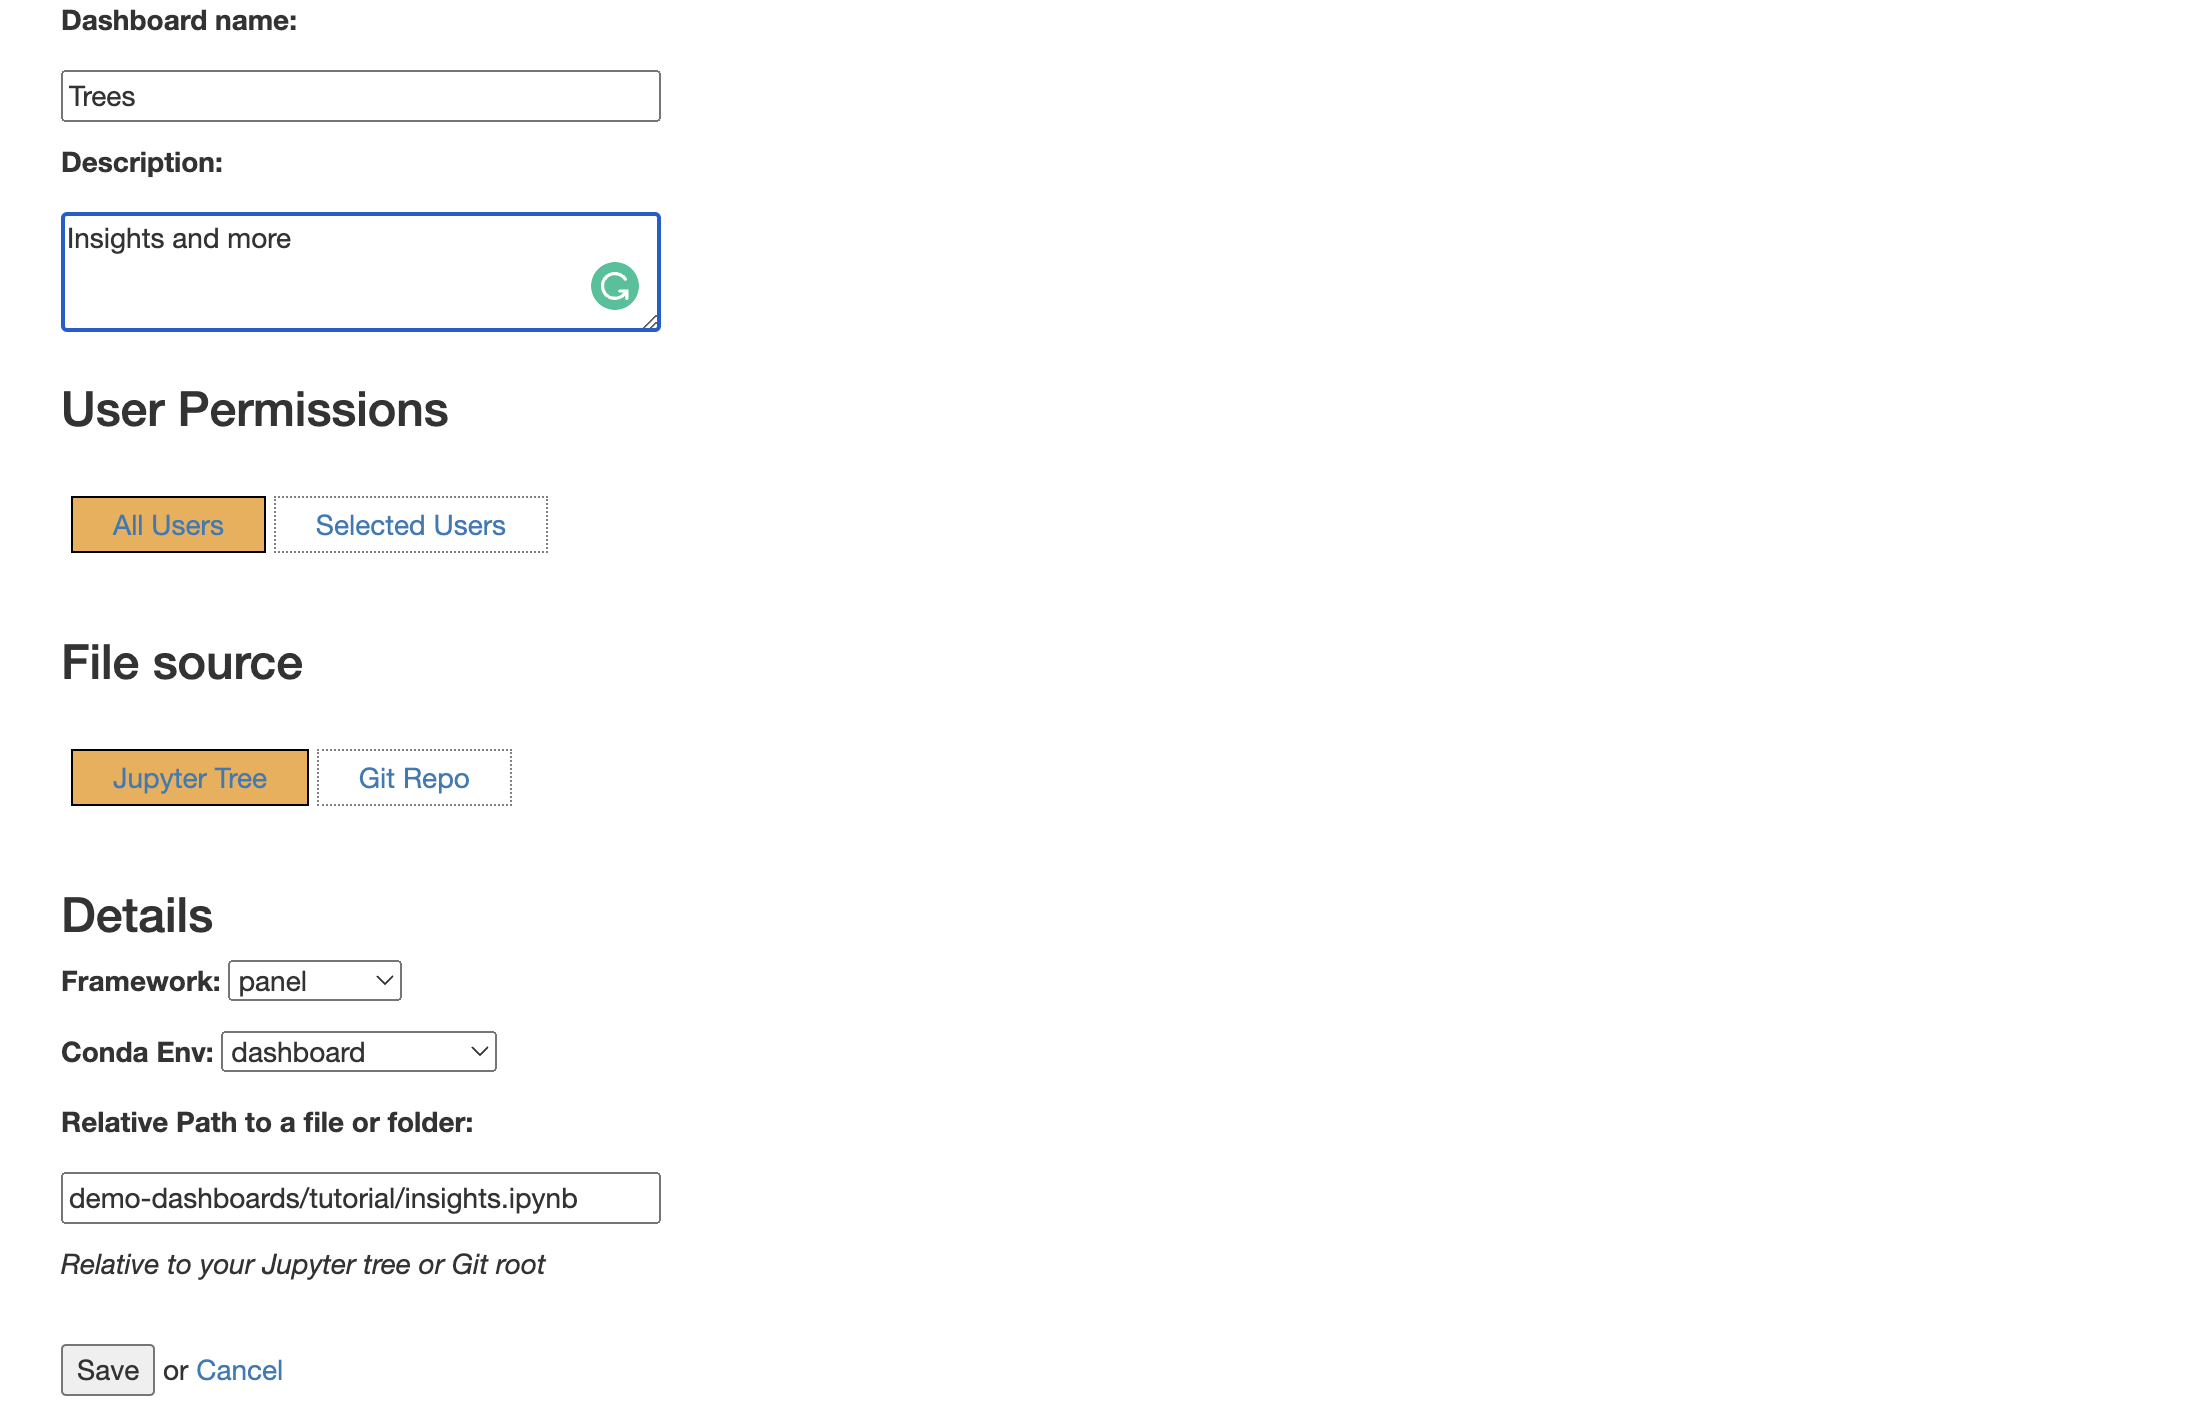
- Give your dashboard a name, for example,
Trees. This name will be the name of your shareable dashboard, so make sure to give this a meaningful name. - Add a short description, for example,
Insights and more. - Set the correct user-access permission (optional). This setting allows you to share your dashboard with all the other users on your Nebari deployment or select specific users.
- Select the code source for your panel. For example, in this tutorial you created a new notebook
panel-trees-dashboard.ipynb, but you can also point to a Git repository. - Select the appropriate framework for your dashboard, in this example you'll have to select:
panel. - Select the
condaenvironment for your dashboard, make sure it is same as the one you previously selected as your Jupyter notebook environment - In the
relative pathbox, copy your notebook's path (example:demo-dashboards/tutorial/panel-trees-dashboard.ipynb). - Once you have provided all the details above click on the save button.
You will then be redirected to a new window where you will be able to select the compute resources for your dashboard.
warning
The available compute instances might vary depending on the configuration and cloud provider of your Nebari instance.
Also, the best instance type for your dashboard will depend on your specific use case.
An example of available compute instances available within a Nebari instance is shown in the following image:
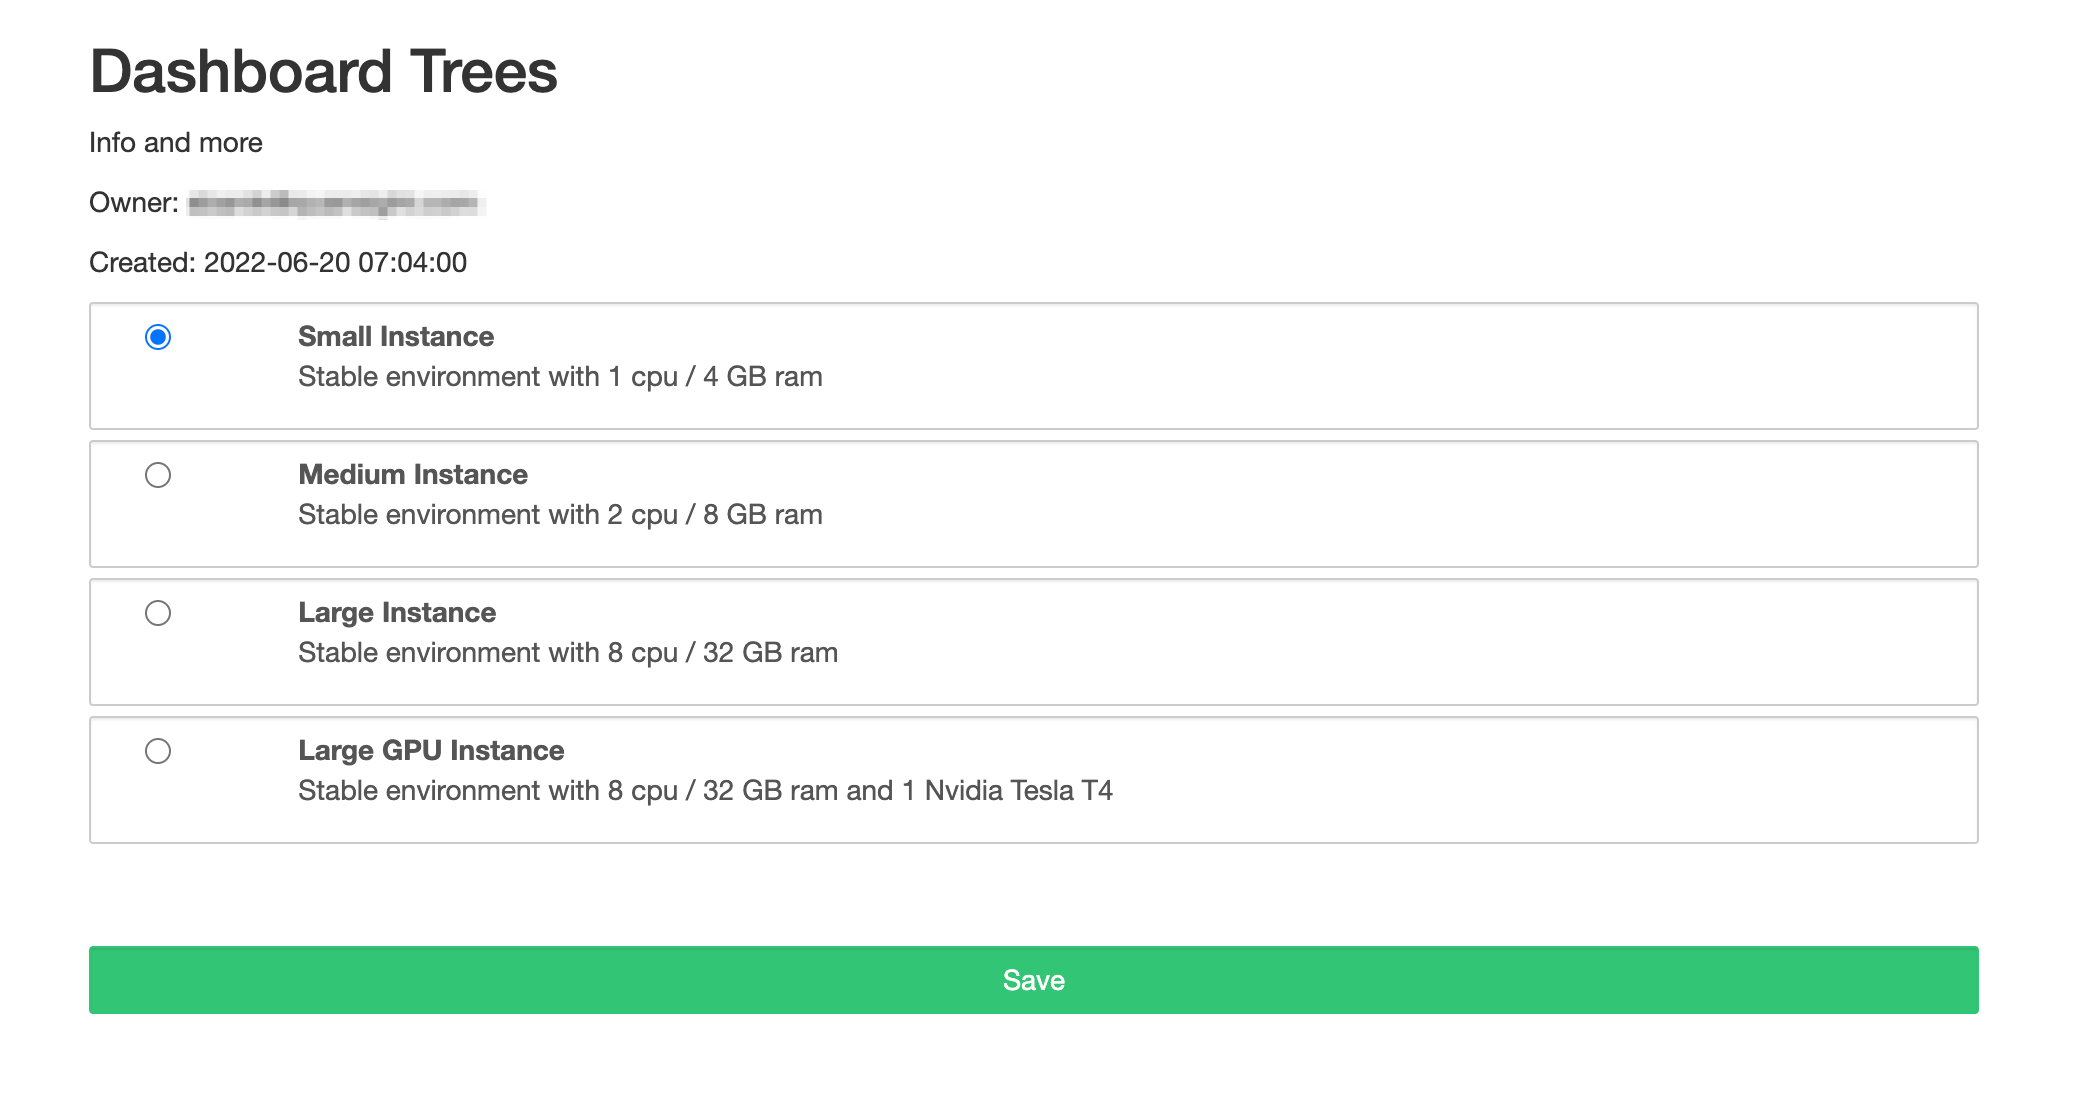
For this particular tutorial, a small instance should be enough. Once you have made a selection you can click on the Save button at the bottom of the window. This will trigger the deployment of your dashboard, and you'll be presented with a screen displaying the of this process.
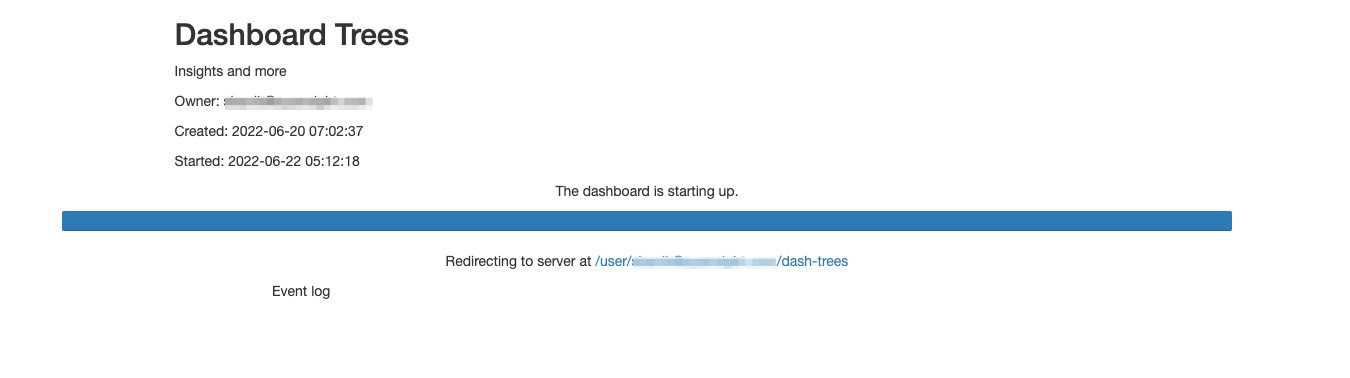
If there are no errors encountered during this process, you will be automatically redirected to the dashboard!
warning
Remember that while the dashboard is running, it will continue to consume resources. You should be mindful of the incurring ongoing costs while the dashboard is running.
Step 3 - Accessing the dashboard inside Nebari
From JupyterLab click on the File menu tab, then select Hub Control Panel -> Dashboards.
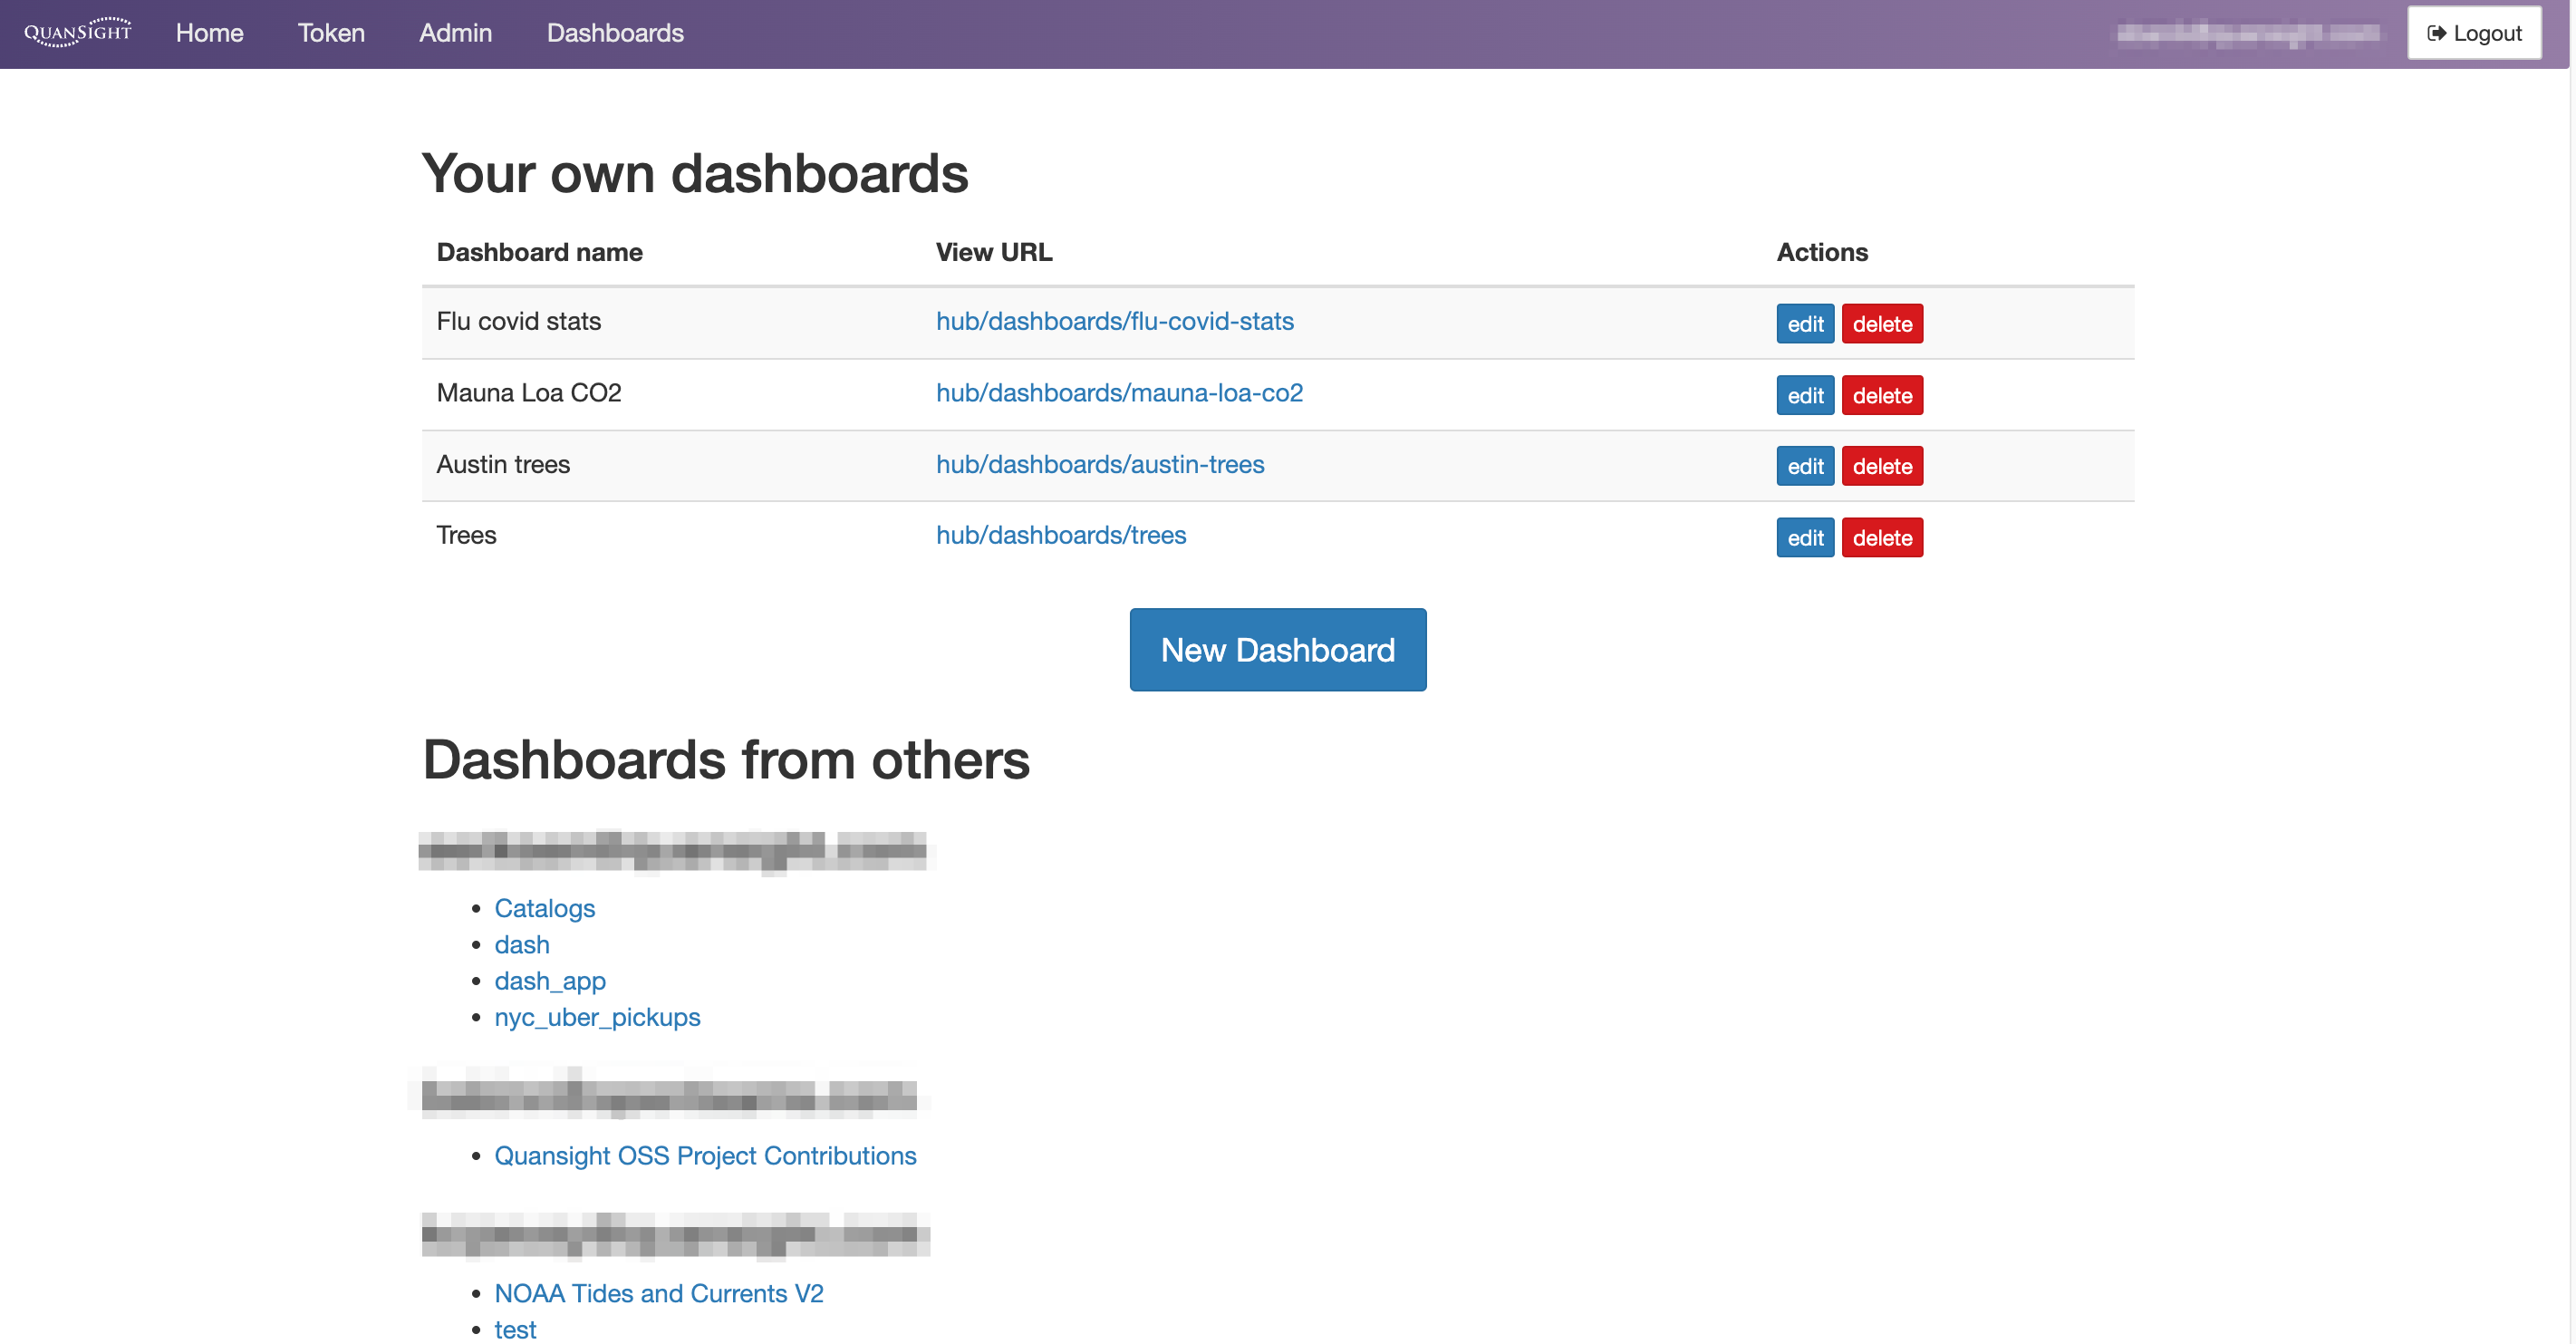
This will redirect you to Nebari's Dashboard main panel. Here, you can find the URL of your dashboards which can be shared with other users, as well as manage the status and deployment of your dashboards:
- To stop the dashboard server click on the
stopbutton. - To start the dashboard server click on the
startbutton. - To delete the server and the resources allocated click on the
deletebutton. - To make any changes to the existing CDS options, click on the
editbutton.
 .
.
Conclusion
Dashboards can be a very handy tool to share information and insights with colleagues and external customers or collaborators.
Now you have a working shareable dashboard 🎉 You can use this basic dashboard to build more complex dashboards, add more dynamic features, and start sharing data insights with others.